Start with the gauge in your hand, not the record. Rain gauge calibration sounds like a laboratory job, and for a national network it is, but the version a grower or an agrovet needs is simpler: pour a known volume of water into the collector, read what the gauge says, and compare it with what the arithmetic says it should read. Agreement means the gauge is counting right. A gap, and the size of that gap, tells you where to look. Every step below carries the number that governs it, and most of those numbers come from the FAO annex on rainfall measurement, which is the closest thing to a standard that a farm gauge is likely to be held to. None of this guidance was written for Kenya: the FAO annex is general, the tipping bucket figures come from a Cornell extension network in New York State, and the calibration procedure is from a UCAR station project in Colorado. Physics travels. Equipment, wind and storm intensity do not, and I say so where it matters.
What the millimetre on the gauge is actually measuring
The FAO annex calls a rainfall total the depth of water that would cover a horizontal area if nothing ran off, soaked in or evaporated, measured in millimetres. That definition is the whole basis of the check; collector area is the fixed quantity. Depth is what you want. Volume caught is what you can measure with a jug, and one line ties the three together: depth equals volume divided by area.
FAO gives the field version directly. If you have no measure made for the gauge, take a cylinder graduated in cubic centimetres. Divide the observed volume by the collector's surface area in square centimetres. That gives centimetres of rain. Multiply by ten for millimetres. The annex warns that errors can be greater this way than with a purpose-made measure. The sum itself is exact, though, and everything else in this article is a variation on it.
Work it once with the collector sizes the annex recommends, 200 to 500 square centimetres. One millimetre is 0.1 centimetres. Take a 200 square centimetre collector: one millimetre of rain is 0.1 multiplied by 200, which is 20 cubic centimetres. A cubic centimetre is a millilitre. On 500 square centimetres, the same millimetre is 50 millilitres. Same rain, two and a half times the water in the bigger funnel. A jug that reads correctly on one is wrong on the other. That mismatch is the most common fault in a farm gauge.
Measure the funnel first
You cannot check a gauge without knowing its receiving area. The figure on the packaging, if there is one, is not evidence. Measure the inside diameter of the rim with a ruler in centimetres, across two directions in case it is not round. Halve it for the radius. Area is radius times radius times 3.14. Every later step depends on that number, so write it on the gauge with a marker.
For a container with sides that are not straight, the UCAR science education page on measuring rainfall gives the method. Measure the diameter at the water level after subtracting twice the wall thickness. Measure the bottom diameter. Average the two, halve for the average radius, and compute volume as depth times radius times radius times 3.14. Then divide by the top area. This matters on a Kenyan smallholding, where the gauge in use is often a cut jerrycan or a tapered bucket. A tapered container read as if it were straight over-reports every event.
Cheap or homemade gauges often break two shape rules from the annex. The receiving area should sit between 200 and 500 square centimetres. The funnel slope should be steeper than 45 degrees, so water runs through rather than pooling and evaporating. A tiny funnel catches so little that a single millimetre is hard to read. A shallow funnel loses part of the catch before it reaches the tube. Neither fault announces itself in the reading. Both show in the jug check as a gauge that reads consistently low. An agrovet plastic tube passes on both counts if its rim is intact. A chipped or ovalised rim changes the area and should be measured, not assumed.
The jug, and why its graduations may not be yours
FAO is specific about the measuring cylinder. It should be clear glass or plastic, with a diameter no more than one third of the gauge rim's, and graduations engraved clearly at 0.2 millimetre steps. Resolution is the reason for the one-third rule. A narrow cylinder turns a small volume into a tall column. A fifth of a millimetre of rain then becomes a visible gap between two lines, where a wide jug squashes the same water into a layer you cannot read. It is also why the annex says rainfall is observed in units of 0.1 millimetres, with anything below 0.05 millimetres recorded as a trace rather than zero.
Here's the trap. A cylinder marked in millimetres of rain is marked for one collector area only. Those lines are the volume sums from the step before, already worked out for that funnel. Put it under a different funnel and every line is off by the ratio of the two areas. Take the FAO range as the example: a cylinder made for a 500 square centimetre collector expects 50 millilitres per millimetre. Pour in the 20 millilitres that one millimetre gives you on a 200 square centimetre funnel, and the cylinder reads 0.4 millimetres. Nothing broke. You have paired two parts that were never meant for each other.
Most calibration advice skips this geometry audit. It should be the first thing you do with a second-hand gauge, a replacement cylinder, or a gauge put together from two brands. Ask what area the cylinder was graduated for. If nobody can tell you, forget its rain scale and treat it as a volume measure: read the millilitres, divide by your measured area in square centimetres, multiply by ten. Slower every morning, but right. A kitchen jug marked in millilitres does the same job. Given a choice between a mismatched purpose-made cylinder and a plain jug, take the jug.
Where the inner tube multiplies the reading by ten
Many standard gauges have no separate cylinder at all. The funnel sits over an inner tube that is deliberately narrow, and the UCAR page gives the proportion: the tube is just small enough that water stands in it ten times deeper than it would in a gauge with no funnel and no tube. So each inch in the tube is a tenth of an inch of rain. That factor is already in the printed scale, and it is what lets you read a tenth of a millimetre by eye.
The ten-to-one factor only holds while funnel and tube are the original pair. Swap a tube from one gauge into another gauge's funnel and the printed scale turns to fiction. That is the mismatched-cylinder fault, now hidden inside the instrument. Catch it the same way: pour the volume your measured funnel area says is one millimetre, then see if the tube scale agrees. A reading of 1.0 means the pair matches. Any other figure, work out the real ratio from your pour and relabel the tube. Don't throw it away.
When the tube overflows, the outer can catches the excess and you pour it back through the tube in stages. Each refill is read on the same scale and the readings added by hand. That is where wet-morning mistakes creep in, so keep a written tally. Across our own network, station totals from 25 September to 25 October 2026 ran from 0.0 to 53.5 millimetres over ten stations. The same month can be a dry gauge on one farm and an overflowing one on the next.
Pour a known volume and read the gap
Now for the calibration itself. Move the gauge indoors or onto a sheltered flat surface. Wind that spoils a real catch spoils a pour too. Fill a jug with a volume you have worked out to be a whole number of millimetres for your measured area: 0.1 multiplied by the area in square centimetres, for each millimetre. On the FAO endpoints that is 20 millilitres on a 200 square centimetre collector, and 50 on a 500. Pour it slowly through the funnel so nothing splashes out. Read the gauge the way you would on a wet morning: eye level, bottom of the meniscus.
No graduated jug? A kitchen scale works just as well. The UCAR 3D-PAWS tipping bucket procedure makes exactly this swap, taking the density of pure water as one gram per 1,000 cubic millimetres. So one gram is one cubic centimetre, which is one millilitre. Weigh an empty cup, add water until the scale shows the grams you want, and you have your volume without graduated glass. Any agrovet that sells by weight already has a scale good enough for this.
Repeat at two or three volumes: one millimetre's worth, five millimetres' worth, and something near the top of the tube. A slightly conical tube can read true at the bottom of its scale and wrong at the top. Write down expected and observed each time, then work out the difference as a share of the expected figure. That share is your gauge's error, and how large it may be is the subject of the section after next. FAO adds one more requirement: readings go down to a tenth of a millimetre, and a pour yielding less than 0.05 millimetres counts as a trace, not zero. If a gauge cannot show a tenth of a millimetre, you cannot check it at that resolution. The cure is a narrower cylinder, not a different pour.
A tipping bucket is calibrated by counting, not reading
A tipping bucket does away with the tube. Instead there is a small seesaw sitting under the funnel. Water collects in one side until it tips and empties, then the other side fills, and every tip closes a switch that the electronics count. There is no water column to read. To get millimetres, multiply the tip count by the depth each tip stands for. That depth is the calibration. In the 3D-PAWS design the target is 0.2 millimetres per tip. The build notes work out the funnel rim radius from the volume of a cylinder, so that one tip equals that depth.
Their procedure starts by bedding in the mechanism: cycle it roughly 1,000 times to cut mechanical resistance. Then pump water through for around 500 tips and divide the total mass in grams by the tip count. Grams per tip is millilitres per tip; divide that by the funnel area to get millimetres per tip. On a farm you do the same with a jug and patience. Pour a weighed volume slowly through the funnel, count the tips from the station log or by ear, and divide. Pour too fast and the bucket under-counts. That is one of the failure modes covered at the end of this piece.
Don't assume the per-tip figure. Cornell's NEWA network reports Rainwise gauges calibrated so each tip records 0.01 inches, which it states as 0.25 millimetres. 3D-PAWS targets 0.2. Different gauges carry different values. On a NuaSense station, the per-tip volume the gauge is calibrated to is set at each installation rather than published as a specification. So the honest check is the pour-and-count above, not a brochure number. Our rain data page explains how the station turns those counts into the ten-minute millimetre figure on the dashboard.
How much error is normal
Growers want one tolerance figure. There isn't one. There are three, one for each cause. The Cornell NEWA note on rain gauge accuracy gives the manufacturer's rating for the Rainwise tipping buckets in its network: 2 percent at 1.5 inches per hour. The note reads that as the gap to expect between a manual gauge and the tipping bucket over the same period: no more than 2 percent. That is for a new, clean, correctly sited gauge in moderate rain. Treat it as the best case.
The same note says tipping buckets are calibrated by the manufacturer. After two or three years in service, though, they can drift, and that drift can produce errors of 5 percent, possibly as high as 10. That is the second tolerance: the aged gauge. Then there is a threshold that turns a check into a diagnosis. A tipping bucket collecting less than 90 percent of what the manual gauge collects most likely has a clog in the collector, not a calibration problem. So a 2 percent gap is noise. A 5 to 10 percent gap is drift and worth recalibrating. Past 10 percent, you stop calibrating and start cleaning. Those three bands are the most useful thing in this article. All three come from one network in New York State. I have no Kenyan equivalent to put beside them, so take them as a starting point rather than a local standard.
A third tolerance dwarfs the other two. FAO says accuracy is mainly affected by wind, by gauge height and by exposure. Wind and exposure errors can be very large, even more than 50 percent. No jug check can see this error, because it belongs to where the gauge stands, not to the gauge itself. A gauge that passes the pour perfectly can still be the worst instrument on the farm. That is why siting comes before the morning with the jug.
The post it stands on
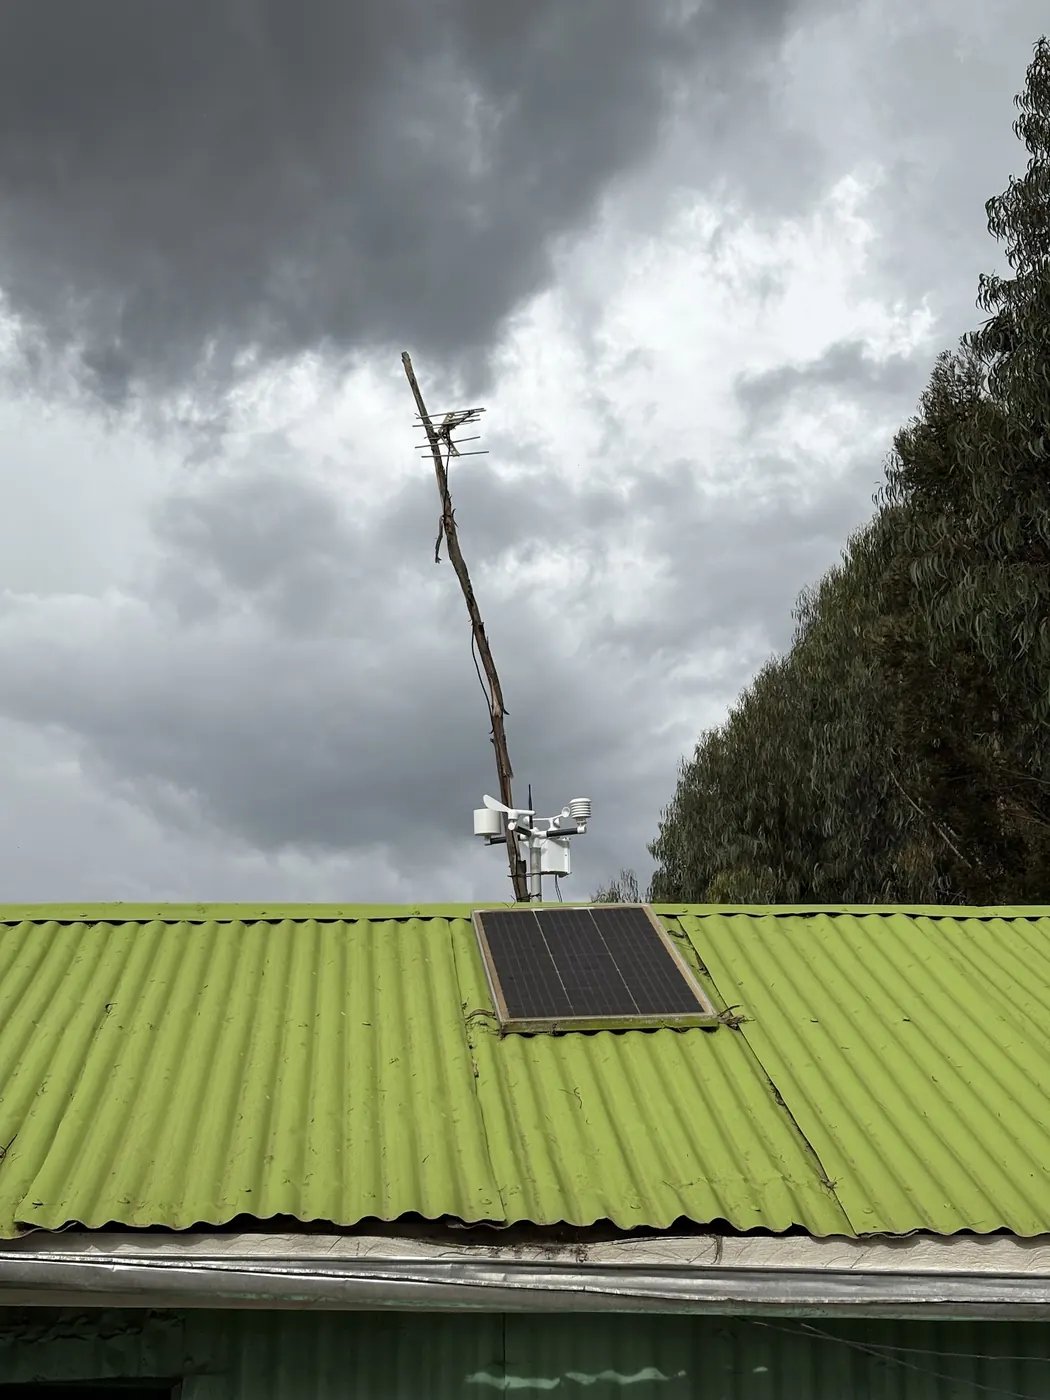
FAO gives the normal height of exposure as 30 centimetres above ground. It states that catch is a function of height, and the difference grows the more open the site. That cuts against a common farm habit: mounting the gauge high on a fence post or a store roof to keep it away from children and goats. A high gauge in an open field reads low, and it reads lower on a windier day. The surrounding ground should be level and uniform, grass or loose earth, with no building, tree or other instrument closer than four times its own height.
Cornell and UCAR come at the problem from the other side. Cornell wants a site protected in all directions but still open to air movement, such as a clearing in a grove. The protection should be no taller than half its distance from the gauge. UCAR calls exposure the greatest single source of error and recommends about twice the distance from the height of the nearest obstacle, while still keeping the gauge sheltered. So FAO says four times, the extension sources say twice, and I would rather name the disagreement than hide it. FAO is specifying a standardised open site so stations can be compared. The extension advice uses surrounding shelter to tame wind. For a farm gauge comparing one season with the next on the same block, the Cornell logic is the practical one, provided the shelter stands on all sides and is not a single hedge upwind. Undercatch and spacing are worked through in the earlier post on rain gauge errors, so I will not repeat them.
Why a checked gauge matters more here than in New York
Rainfall figures come to a Kenyan grower by two routes: the post and the phone. Most of the phone's numbers come from satellites. A long-term evaluation of satellite rainfall estimates over the IGAD region put nine products up against 105 rain gauge observations across East Africa from 2001 to 2020. CMORPH RT came out best, then CHIRPS v2.0, with CPC-RFEv2 and GPM-IMERG in the top four. All of them tended to read a little low. They did better over highlands than over desert and semi-arid areas, and were less accurate in June to September than in the March to May and October to December rains. How dense and how well spread the gauges are in a country, the study notes, decides how well any of this can be checked.
Read that as a grower. Your phone's number was tuned against a sparse set of gauges. It is weaker in the semi-arid counties and in the dry mid-year months, and it leans low. A checked manual gauge on your own block is the only instrument that can tell you whether the phone is close this week. The earlier post on why phone and field gauge disagree worked through the grid-cell problem. This piece adds the part it skipped: the field gauge has to be right before it can referee anything.
Advisory services lean on the same data. The PlantVillage account of its feature-phone advice in Kenya describes weekly weather maps for the whole country, built from CHIRPS and Climate Hazard Center data together with the Kenya Meteorological Service. It also records Busia County in March 2019, when the twin cyclones Idai and Kenneth, which struck Mozambique on 14 March and 25 April, pulled moisture away from the air over Kenya and Uganda, so that many maize farmers got no germination and had to re-sow. In a month like that, a gauge reading low because of a mismatched cylinder, sitting on top of a satellite product that already leans low, pushes a decision the wrong way.
Reading the gauge at the same hour, and writing it down
A gauge that counts right can still give a bad record if it is read at different times. FAO sets the rule: the 24-hour catch observed at or before 09.00 belongs to the previous day. So a reading at 08.00 on 1 December goes against 30 November and counts in November. Follow that and your farm record lines up day for day with a Kenya Meteorological Service record. Let the reading time wander between dawn and lunch, though, and a night storm lands on different days depending on when you walked out. That moves a monthly total by the size of one storm.
Record in tenths of a millimetre, and write a trace as a trace instead of leaving the line blank, because a blank later reads as a missed observation. Dry days are most of the record. Across our network only 290 of 16,589 ten-minute readings carried any rain over 25 September to 25 October 2026, which is 1.7 percent. Confirmed dry intervals are worth as much to a planting decision as the wet ones. Maintenance belongs in the same notebook. FAO's routine is to check for leakage, clear dust and leaves, clean the inside without polishing, keep the cylinder clean and undented, keep a spare, and cut back plant growth around and above the gauge. Cornell puts a frequency on the tipping bucket version, at least once or twice a year, and every three months where leaves, moss, algae, pollen and debris clog the screen and drain. Beside a shamba hedge or under a mango, three months is the realistic interval.
When the cheap gauge, or none, is the right answer
Cornell says plastic gauges with a four inch opening are quite accurate. The eight inch manual gauges NOAA uses are considered the most accurate and cost more. That ordering is everything the sources say about cost, so no shilling figure follows. A decision rule does. For one farm's own planting and spraying decisions, a four inch plastic gauge that has passed the jug check, mounted at the right height on a sheltered site, is enough. A standard gauge buys comparability with official records and a defensible number for a contract or an insurance claim. That is the only reason to pay for it.
A tipping bucket buys one thing: no morning walk, and a time series instead of a daily total. Timing matters when the decision is a spray window or a disease risk, since intensity and leaf wetness are invisible in a 09.00 reading. It does not buy accuracy, as the 2 percent rating drifting to 5 or 10 shows, and Cornell's own advice is to keep a manual gauge beside the automatic one. A NuaSense weather station, at 30,000 shillings excluding taxes, carries a tipping bucket alongside the temperature, humidity, wind and sunlight sensors that the derived spray-window and leaf-wetness figures need. The weather data page sets out what each ten-minute row contains. If a monthly total is all you want, do not buy it. A grower with a working plastic gauge and a kitchen jug already owns every tool this article needs. Where low-cost instruments earn their place on Kenyan farms, and where they do not, is argued in the NuaSense post on IoT applications in Kenyan agriculture, which covers smart irrigation, pest monitoring and phone-based platforms for smallholders.
The ways a count goes wrong
End with the faults, split by the direction they push the number, because that is how you diagnose from the record. False-low causes first. A clogged funnel screen or drain holds water back; below 90 percent of the manual gauge, clean before you recalibrate. Shelter too close, or a gauge mounted high in wind, under-catches, potentially by more than 50 percent on FAO's figure. An ageing tipping bucket drifts 5 to 10 percent. Then intensity. Cornell says tipping buckets under-catch when more than 1.5 inches falls in an hour, because the arm cannot tip fast enough to keep up with the flow through the funnel. Kenyan convective storms can be intense, so a tipping bucket's biggest single event is likely to be its least accurate one. A manual gauge beside it has no such limit, which is the strongest argument for keeping both.
A false high turns up in different ways in the log. Random trickling rain of 0.01 to 0.02 inches, logged every hour or two across a dry day, is in Cornell's experience a clogged bucket slowly draining, a station swaying in the wind, or a faulty reed switch. A total that makes no sense tells the same story. Their example is five inches when it plainly has not rained. That points to a shorted reed switch or cross-communication from another wireless station; they report one-mile-range stations picking up a station two miles away. On a NuaSense station the rain count travels with the rest of the readings, not over a short-range radio link, so that particular fault does not apply. The reed switch and the swaying mast still do. A trickle on a cloudless day is hardware, not weather.
Manual gauges bring their own false highs. A tapered container gets read as a cylinder. A cylinder is graduated for a larger funnel. A tube scale comes from a different gauge. One pour catches every one of them. So the rule for a bad count is short. Pour a known volume. If the pour reads right and the field reading is low, check the site, the screen and the age of the mechanism, in that order. If the pour reads right and the field reading is high, check the switch and the mast. If the pour itself reads wrong, the geometry is wrong. No amount of cleaning or siting will fix a sum.