A rain total of 118.4 mm, and the exactness it does not carry
Between 02 October and 01 November 2026, the 12 NuaSense weather stations in Kenya logged totals from 0.0 mm to 118.4 mm. Those stations sit far apart, so the spread tells you nothing about any single region. What matters is the shape of the number. A total of 118.4 mm sounds like somebody stood out in the rain holding a measuring cylinder. It isn't that. A gauge counted the tips of a small bucket, and software multiplied that count by the per-tip volume the gauge is calibrated to. That decimal is arithmetic, not accuracy.
Every agrovet conversation about stations runs on the same old idea: a machine reading is exact, a person's reading is rough. On the ground it falls apart for a simple reason. A sensor measures the air or the rain that actually reaches it, and on a Kenyan block the mast usually stands beside the store, inside the tree line, or wherever the solar panel catches the sun. Each sensor then carries its own error from its own cause, and those errors don't all matter to the same decision. A thermometer running warm in the afternoon can wreck a degree-day sum and leave the spray call untouched. An anemometer under-reading behind a hedge does the opposite.
NuaSense publishes no plus-minus tolerance for any sensor on its station, and no Kenyan trial in the sources gives an error band for a farm-grade station either. So this piece works through the mechanism sensor by sensor: what the instrument senses, what pulls it off the truth, and which Monday decision moves with it. Where nothing was measured in Kenya, the gap is stated rather than filled.
Rain: a bucket that counts, a funnel that misses
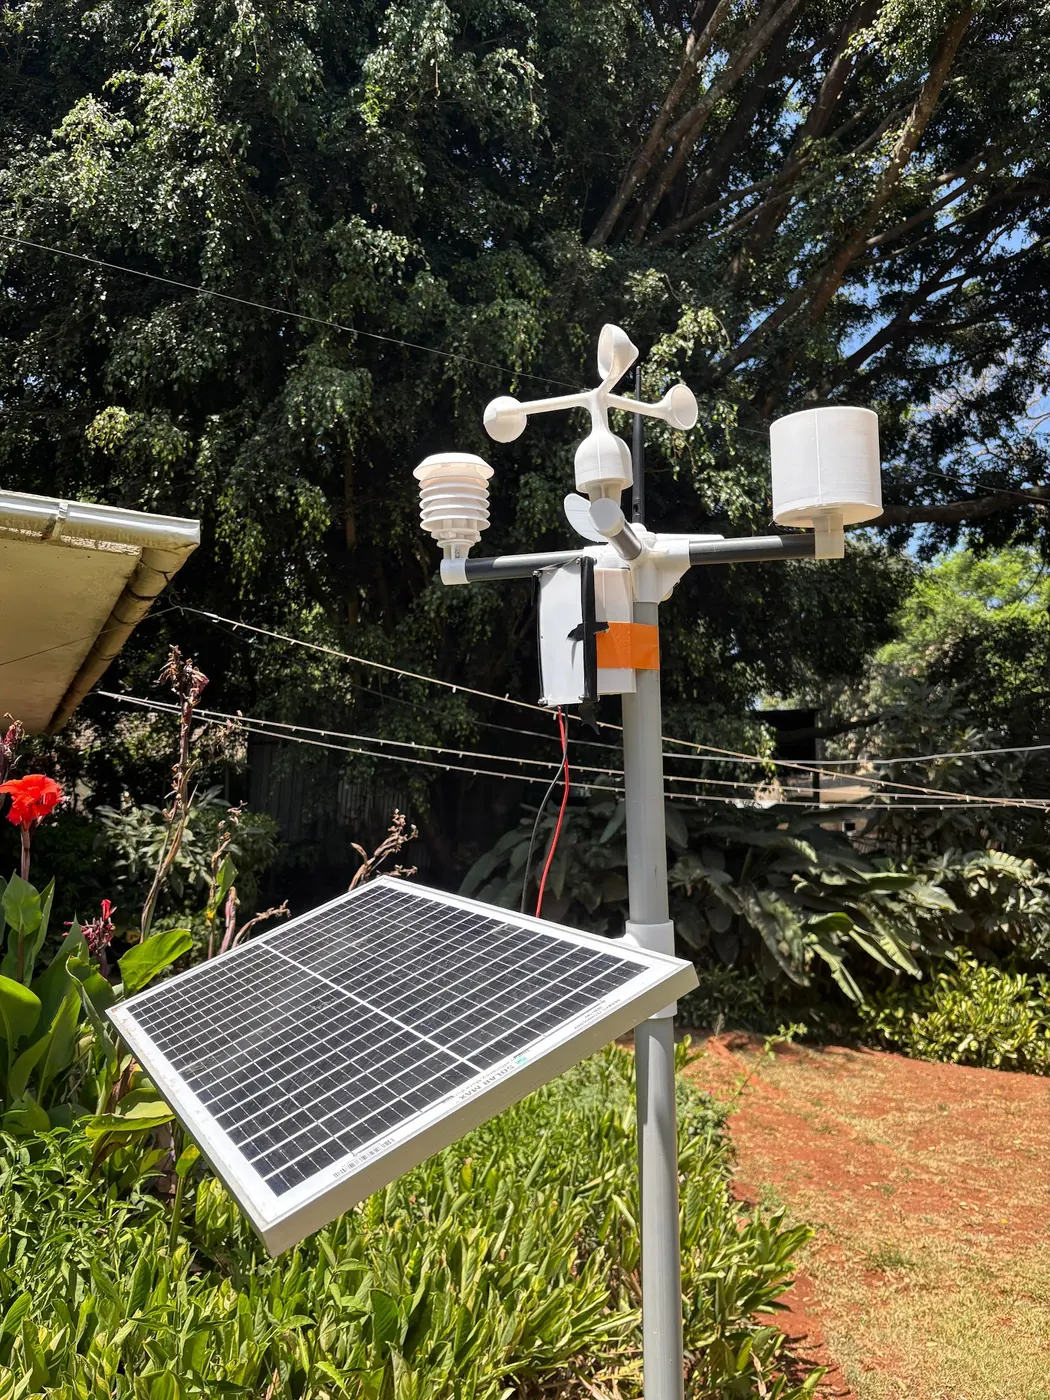
A tipping-bucket gauge doesn't weigh rain. Water runs down a funnel into a small see-saw; each time one side fills it tips, empties, and a magnet closes a switch once. So every error in the final millimetre lives in one of two places: the count, or the conversion from count to depth. Counts go wrong when leaves or a wasp nest part-block the funnel, when the bucket sticks, or when rain comes down so hard that water splashes over mid-tip. Conversions go wrong when the per-tip volume has drifted. That is why pouring a known volume through the gauge is worth an afternoon; the post on checking a rain gauge already covers the procedure.
Undercatch is the error a grower never sees on the phone. Wind crossing the rim of a raised funnel lifts and deflects drops that would otherwise have landed inside, so the gauge reports less than fell on the ground beside it, and it under-reports by more as the wind rises. No source in hand gives a percentage for a farm-grade gauge in Kenya and none is offered here. The mechanism alone is enough to act on: a gauge high on an exposed mast catches less than the same gauge near the ground with clear sky above it, and the bias runs one way only, downward.
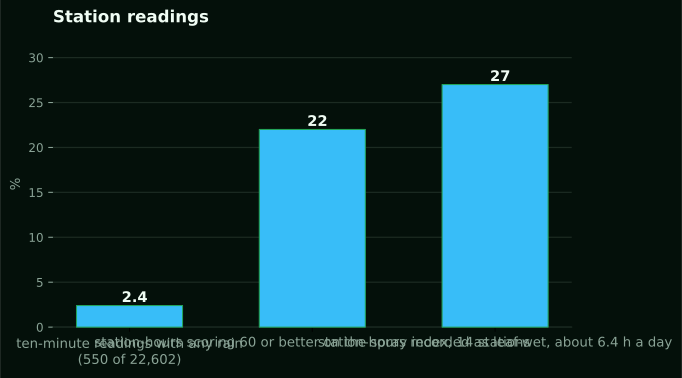
Which decisions this touches depends on the size of the question. Over the same October period, only 550 of 22,602 ten-minute readings carried any rain at all, which is 2.4 percent. Most of the time there is nothing to miss. Asking whether a sowing got enough moisture to germinate is a coarse question, and a gauge that under-reads a little still answers it. Asking how much irrigation to deduct for last night's shower is different: undercatch shows up directly as over-watering, and where the gauge sits starts to matter more than what it cost.
Air temperature: the shield is the instrument
Across 15 NuaSense stations in Kenya from 02 October to 01 November 2026, air temperature ran between 0.0 and 36.7 °C with a mean of 19.8 °C. Behind those figures sits a thermistor, a cheap and reliable part. What decides whether it reports air temperature or something else is the white louvred box around it. FAO's annex on the integrity of weather data states that temperature sensors must sit in naturally ventilated radiation shields, and that shields are sometimes artificially aspirated with a fan to reduce the bias caused by heat loading from the sun. A sensor in direct sun, or in a shield with no airflow through it, measures a warm plastic box.
FAO gives no figure for that bias and none is given here. Its direction, though, is reliable: still, sunny afternoons push the reading up, and the push is largest exactly when the air is hottest. On a Kenyan block near the equator, with strong midday sun through most of the year, the condition that creates the bias is the normal one, so a poorly ventilated shield errs on more afternoons than it would in a northern trial. Night readings are far less affected, with no sun to load the shield. If a grower's station reads well above the shaded thermometer on the store wall at two in the afternoon and agrees with it at dawn, that is a shield problem, not a broken sensor.
Where this error really bites is in the decisions that add temperatures together. Arizona's grower guide to selecting weather stations points to cumulative growing degree days, worked out from temperature data, as the basis for tracking crop development, timing irrigation, and predicting pest outbreaks and harvest. Every day, a warm afternoon bias goes straight into that sum. Decisions about cold nights, such as whether a chilling threshold was crossed, are much safer, because the bias is not there at the hour that counts.
Humidity, and the stretch near saturation
Relative humidity at the same 15 stations averaged 70 percent, with a range of 18 to 100 percent. Inside the station, a thin polymer film absorbs water vapour and changes its capacitance. Through the middle of its range it is a decent instrument. At the top it is worse, because the film sits near saturation for hours, drifts, and comes back slowly once the air dries. Humidity also inherits the temperature error. Relative humidity is a ratio that depends on air temperature, so a shield running warm makes humidity read lower than it actually is at the same hour.
The sources hold no measured error band for this sensor on a Kenyan farm. What they do hold is a comparison from a different kind of station altogether. A study of a virtual weather station for southern Ukraine on the FAO AGRIS database set modelled Visual Crossing data against ground measurement. It found relative humidity errors of MAPE 9.1 percent and RMSE 7.53 percent, and air temperature at MAPE 4.5 percent and RMSE 0.94 °C. Those are errors in a modelled product in a temperate steppe climate, not errors in a physical sensor on a Kenyan mast. They are quoted for one reason only: even a modelled source got these two variables reasonably close, which marks them out as the forgiving ones in any system.
When a decision hangs on humidity, it usually hangs on the top of the range, and that is exactly where the sensor is weakest. Dew point, vapour pressure deficit and leaf wetness duration are all computed from temperature and humidity together. NuaSense derives all three rather than measuring them. Over the October period the computed VPD averaged 0.90 kPa and peaked at 4.78 kPa. High-VPD afternoons you can trust. The softest derived number comes in the leaf-wet dawn hours, when humidity sits at 100 and the film is saturated.
Wind is where the error lives
The cups spin, each rotation gives a pulse, and the station turns pulses over an interval into a speed. A gust is the peak inside that interval, not a separate measurement, and the wind data page explains the conversion. So the sensor itself is simple. What makes wind the least accurate reading on nearly any farm station is everything around it. FAO's annex says plainly that the accuracy of wind speed measurement depends on the upwind fetch as much as on the instrument, and that a large fetch free of buildings and trees is definitely required for a representative reading. It also puts the anemometer at a height of not less than 2 m, often 5 m, following WMO practice.
The same southern Ukraine study makes the point from the other side. Its wind speed at 2 m came out at a MAPE of 104.3 percent and an RMSE of 1.20 m/s, which the authors call unsatisfactory, while temperature and humidity from the same source were acceptable. Again, that is a modelled product in Ukraine, not a Kenyan cup anemometer. What transfers is the pattern, not the figure. Wind is the one variable a distant or modelled source cannot stand in for, because the hedge, the shed and the slope within sight of the mast set it. Arizona's guide says the same in grower language: wind speed and direction vary more with local conditions than other parameters, and they are critical for timing sprinkler irrigation and chemical spraying to limit drift.
A Kenyan block makes this worse than a flat Arizona field. Smallholdings are small, boundaries carry trees for timber and shade, and the mast usually goes where the panel is safe rather than where the fetch is clear. A reading taken in the lee of a eucalyptus line under-reports the open-field wind by an amount nobody has measured. It under-reports most on the gusty afternoons that decide the spray call. In practice the fix is rarely a better sensor. Weather station siting problems are usually an afternoon's work, and that post sets out which ones. Move the mast before you doubt the cups, and carry a cheap handheld meter into the sprayed block to see how far the mast is from the field. This is the single reading where siting does the most financial damage, and the one where no spec sheet helps.
Sunlight, and the number computed from everything else
A farm-grade station almost always carries a silicon diode pyranometer, and FAO's annex is specific about its limit: silicon diodes are not fully sensitive to the whole visible spectrum, so their calibration is valid only for upward solar measurements, and accuracy depends on the sensor material, response time and distortion of the dome. Net radiometers, it adds, lose sensing capability with time and need regular, frequent calibration. On a farm the errors are duller. A dome coated in dust after a dry spell. A panel or tree shadow in late afternoon. A sensor mounted slightly off level.
Sunlight counts less as a reading than as an input. Reference evapotranspiration is worked out from sunlight, temperature, humidity and wind together. NuaSense computes it hourly with FAO-56, and across 14 stations in October 2026 it averaged 1.6 mm per day. That is a reference figure, not crop water use. FAO is blunt that ET0 estimates are only as good as the weather data behind them, so every sensor error in this article lands on ET0 at the same time. One detail from the Ukraine study deserves a pause. Modelled ET0 for April to September had a MAPE of 13.7 percent and RMSE of 0.62 mm, and a correction factor of 0.95 lifted May to August accuracy to 89 percent. Yet refining the meteorological inputs cut ET0 accuracy by 4.8 percent and pushed RMSE up by 0.15 mm. Tinkering with inputs does not reliably improve the result. Check the shield and the fetch first. Those are the inputs that move it.
The spray window and the leaf-wet hour
Over 7,204 station-hours at 14 stations in October 2026, 22 percent scored 60 or better on the NuaSense spray quality index. Another 55 percent scored below 30. The index runs 0 to 100 and is worked out hourly from the station's own readings. Leaf wetness was recorded for 27 percent of station-hours, roughly 6.4 hours in an average day. Both come from temperature, humidity and wind, so both carry those sensors' errors in proportion to how much each one drives the result.
A spray window is a wind decision first. That is why the fetch problem lands here hardest. A station sitting in the lee of a windbreak reports a calm hour that is not calm out in the open field, and the grower sprays into drift. Shield bias barely touches that call.
Leaf wetness duration is a humidity decision. It is weakest exactly where the sensor is weakest, in the saturated hours around dawn. Say a station reads 100 percent for an hour longer than the canopy stayed wet. It will overstate disease risk and push a spray that was not needed. A station that dries faster than the leaves does the opposite, and that happens when its shield sits in the sun while the crop is in shade. Neither error changes anything on a clearly wet or clearly dry morning. They matter on marginal mornings. That is why the leaf-wet figure is best read as a count of risky mornings across a season, not a verdict on any single day.
Six miles and sixty miles
Before you pay for any of these sensors, ask two things: how far away the nearest maintained station is, and what decision is at stake. Arizona's guide, citing WMO 2008, says weather data are most reliable within a 60-mile radius for large-scale weather patterns, and within 6 miles for local applications such as precision farming, where the data feed irrigation. Those radii were written for an American network. They are not a Kenyan rule, but the logic travels. Whether a wet week is on its way is a sixty-mile question. How much water a block lost yesterday is a six-mile question, and often a shorter one.
That guide reports a small test in a Gila Bend field. Relative humidity from an on-farm Li710 device was compared over 12 to 19 February 2025 with AZMet stations at Paloma 15 miles away, Buckeye at 27 and Harquahala at 41. Preliminary findings suggest an on-farm station could improve the representativeness of ETo, and the authors ask for more data. One week, one variable, one desert valley: it cannot be stretched into a Kenyan threshold. Why the nearest weather station does not describe your farm works through the Kenyan version, with the altitude and aspect differences that make a few kilometres in the highlands behave like many in Arizona. If the only decision you make from weather data is seasonal, a public gauge is enough. If it is daily irrigation, or this afternoon's wind on this block, the distant station's error is not a few percent. It is a different place.
When the right purchase is nothing
FAO's annex has a sentence worth more than any accuracy specification: no data are better than bad data, because biased, faulty or non-representative local weather data can lead to evapotranspiration and irrigation decisions that cause more economic and hydrologic harm than a reasonable estimate or a textbook crop coefficient would have caused. Treat that as a purchase rule. If the only site you can use is inside the tree line, if nobody will clear the funnel or pour a known volume through the gauge, or if the shield cannot be kept in open air, the station will produce confident wrong numbers. A grower is better off without them.
Arizona's guide splits basic stations from research-grade systems. Basic stations carry cheaper anemometers, thermistors, hygrometers, barometers, rain gauges and pyranometers. Research-grade systems add higher quality sensors plus crop, soil and irrigation-status sensing. Its verdict is even-handed: affordable stations can be highly effective when properly installed and maintained, while high-end models provide greater accuracy and more features. At the cheap end of the published range sits the IWMI mobile weather station, an open-source unit costing $350, solar powered, logging rainfall, temperature and wind every five minutes to a microSD card with SMS alerts and a stated life of up to ten years. IWMI gives no accuracy band and no Kenyan deployment, so it stands here as a price point only. At the other end is a maintained network like Arizona's 32-station AZMet.
A NuaSense weather station costs KES 30,000 before taxes. It reads air temperature, humidity, pressure, sunlight, rainfall, wind speed, gusts and direction about every ten minutes, runs on solar, and gets itself onto the internet over a Safaricom SIM or Wi-Fi, with the data fee passed on at cost. LoRaWAN soil sensors, at KES 7,000 each, also come online through it. It publishes no tolerance figure, and nothing above should be read as one. If all you need to know is whether sowing week was wet, buy a plastic tube gauge instead. If you have no clear site yet, buy nothing until you do.
The error table Kenya does not have, and how to start your own
Search for weather station accuracy in Kenya and what you mostly get is papers about forecasts, which are a different thing. A systematic review in Frontiers in Environmental Science went through 25 articles from 2000 to 2022 and found that users in East and West Africa mainly received rainfall and temperature information by radio, mobile phone and television. Most of it was generic rather than impact-based, and a lack of downscaled information, plus trust, hindered use. A Springer paper on indigenous knowledge for seasonal forecasting in East Africa adds that scientific forecasts are issued for wide areas, so farmers lean on their own indicators, whose accuracy has largely never been documented. Neither says anything about whether a gauge on a farm counts correctly. NuaSense forecasts nothing; its October 2026 figures here are a past record. The one Kenyan hardware paper in hand, on an IoT mini weather station in the National Research Fund repository, logs humidity, temperature, light and pressure to a cloud server and reports no error band. Even the Aston University study of citizen weather stations, which tested consumer models against Met Office equipment, gives no values in the excerpt available, and that was British weather anyway.
So the honest position is a gap. A PMC paper evaluating station data against satellite products calls ground stations the gold standard, insofar as one exists. It lists their limits, record-keeping gaps among them, and CHIRPS and GLDAS performance that varied by site and variable with no obvious pattern. Then it advises researchers to install their own station rather than choose between distant records and unverified estimates. That applies word for word to a commercial farm, and the Kenya Meteorological Department's reference gauges are too few for most growers to lean on. Regional signals, like the shifting rainfall and rising temperatures that NuaSense's post on climate change and Kenyan crop yields covers across farming regions, are a national network's job. The single farm station answers the field.
There is no Kenyan error table, so build a small one. Put a plastic tube gauge at ground level in the open, a stride from the mast, and after each rain log the gap against the tipping-bucket total for a season. Hang a shaded thermometer in free air at shield height and read both at two in the afternoon and at dawn; the afternoon gap is your shield bias. During spray hours, stand in the open field with a handheld anemometer and note how far the mast under-reads. The University of Georgia's field report on station placement reduces the rest to one line, that placement is critical and the equipment belongs in the growing area, and Arizona adds the ten-times-obstacle-height distance. A season of those notes tells you the accuracy of your own station better than any spec sheet, and better than this article can.